AP Human Geography › Unit 1
AP Human Geography Unit 1: Thinking Geographically
Geographers ask why things are located where they are. Unit 1 introduces maps, projections, and geographic data, along with key ideas like location, place, distance decay, time-space compression, and scale. It also covers how people and environments shape each other. Exam questions ask you to identify the type of data a map shows and explain what a pattern means. Scale of analysis gives many students trouble, since a pattern at the global scale can look different locally. Students also confuse environmental determinism with possibilism, which stresses human choice.
Practice this unit
Topics in this unit
- 1.1 Introduction to Maps
- 1.2 Geographic Data
- 1.3 The Power of Geographic Data
- 1.4 Spatial Concepts
- 1.5 Human–Environmental Interaction
- 1.6 Scales of Analysis
- 1.7 Regional Analysis
Free-response questions
- Geographic Data for a Flood Plan
- Regions and Scales of Analysis
- The Shrinking Aral Sea
- Map Projections and Distortion
- U.S. Population at Two Scales
Sample questions
These are taken from the Regular set, with the answer and explanation shown.
1. An environmental scientist maps ten-year changes in boreal forest canopy across Canada using Landsat satellite images. What is a limitation of this data?
- AIt cannot cover an area as large as Canada’s boreal forest
- BIt cannot detect changes in vegetation from one year to the next, only once a decade
- CIt records each landowner’s reasons for cutting down trees
- DIt is qualitative data gathered through personal interviews
- EIt shows where canopy changed but not why people made those changes
Answer: E. Remote sensing records what the land surface looks like from above. It can map where forest was lost. It cannot show the decisions, laws or markets behind the loss; that needs sources such as interviews or policy documents.
Common trap: Thinking satellites cannot cover huge areas. Broad, repeated coverage is the main strength of remote sensing.
2. A landscape survey of a farming district records gas stations grouped at one crossroads, wind turbines in an even grid, and farmhouses spread widely across the valley. Which term best describes the pattern of the farmhouses?
- AClustered distribution
- BLinear distribution
- CAbsolute location
- DDispersed distribution
- ETime-space compression
Answer: D. In a dispersed pattern, features are spread far apart across an area. The gas stations are clustered, grouped tightly together. The farmhouses show the opposite pattern.
Common trap: Picking clustered because the survey also mentions a cluster. The question asks only about the farmhouses.
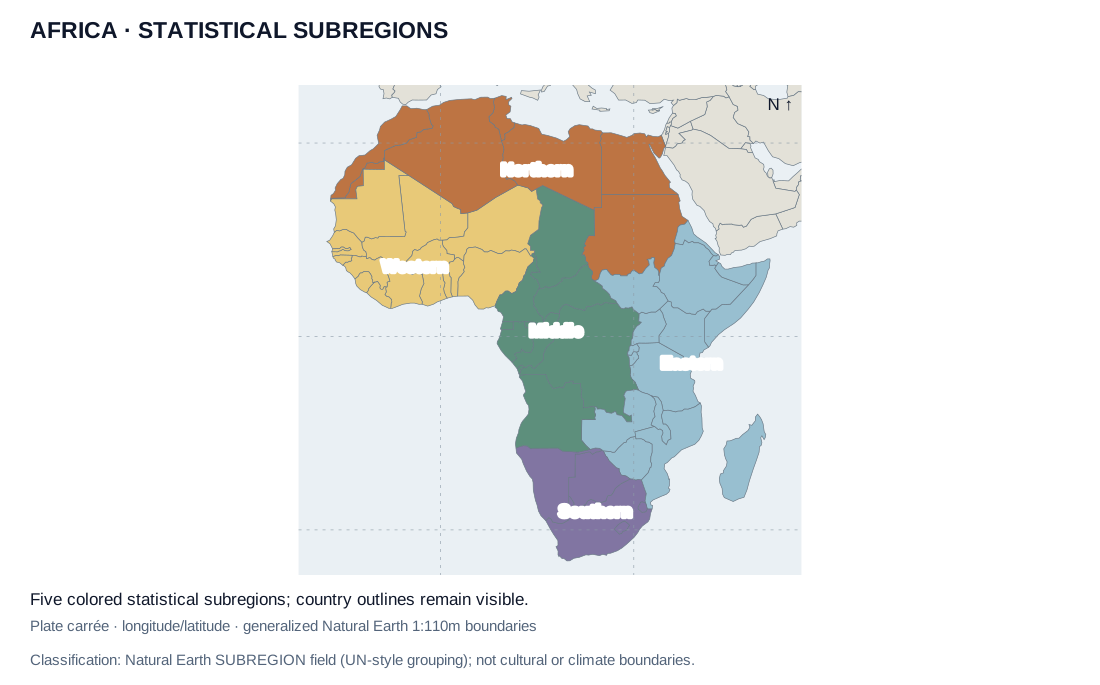
Original map from Natural Earth country geometries and SUBREGION attributes, which use UN-style statistical groupings. Dataset accessed October 2026. Source
Enlarge source
3. An analyst compares average urbanization across the five colored subregions. Which step would best test whether the regional averages hide internal differences?
- ATreat each region’s color as proof that all of its countries are alike
- BReplace each country’s value with its region’s name
- CMeasure only the physical size of each colored region
- DAssume all countries in a region share one government
- ECompare country and subnational data within each subregion
Answer: E. Comparing smaller units can reveal variation hidden by a regional average. A shared statistical grouping does not mean the countries in it have the same conditions.
Common trap: Treating a statistical region as uniform. A shared color reflects a grouping rule, not identical conditions.