AP Human Geography › Unit 7
AP Human Geography Unit 7: Industrial and Economic Development Patterns and Processes
The final unit asks why some places are richer than others. You will study the spread of industry, economic sectors, measures like GDP per capita and the Human Development Index, gender and development, and theories such as Rostow's stages and Wallerstein's world-system theory. Trade and sustainable development close the unit. Expect to interpret development data and explain a theory's strengths and limits. Students often treat GDP per capita as a complete measure of well-being. Another error is labeling countries core or periphery without explaining the economic relationships behind the labels.
Practice this unit
Topics in this unit
- 7.1 The Industrial Revolution
- 7.2 Economic Sectors and Patterns
- 7.3 Measures of Development
- 7.4 Women and Economic Development
- 7.5 Theories of Development
- 7.6 Trade and the World Economy
- 7.7 Changes as a Result of the World Economy
- 7.8 Sustainable Development
Free-response questions
- Industrial Location and Deindustrialization
- Measuring and Explaining Development
- Employment by Economic Sector
- Women in India’s Labor Force
- Coal, Solar, and Sustainable Development
Sample questions
These are taken from the Regular set, with the answer and explanation shown.
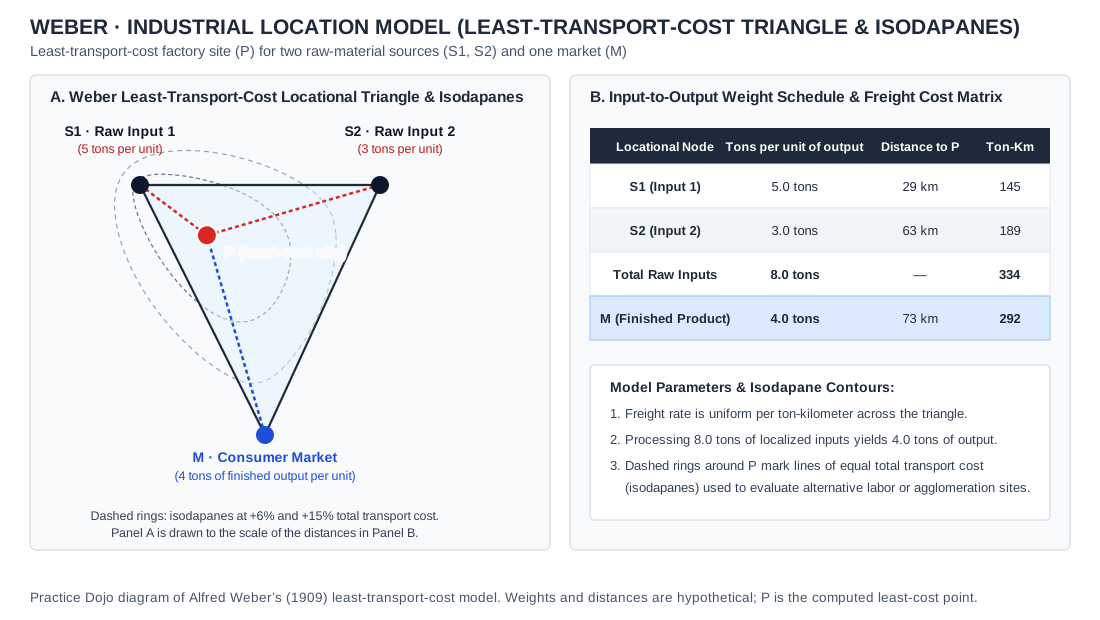
Original Practice Dojo drawing of Alfred Weber’s (1909) least-transport-cost model with hypothetical weights and distances: 5 tons from S1 and 3 tons from S2 (8.0 tons in all) make one unit of output weighing 4.0 tons; uniform freight rate per ton-kilometer; P is the computed point of lowest total ton-kilometers; other location forces held equal. Source & details
Enlarge source
1. Suppose freight costs $1 per ton-kilometer. Using Panel B, a site with cheaper labor lies on the +15% isodapane. What is the smallest labor saving per unit of output that would make that site cheaper than P?
- AAbout $15 per unit
- BAbout $94 per unit
- CAbout $44 per unit
- DAbout $50 per unit
- EAbout $626 per unit
Answer: B. Total transport cost at P is 334 + 292 = 626 ton-km, or $626 per unit. A site on the +15% isodapane costs 0.15 × $626, about $94, more. Labor savings must exceed about $94 per unit for the move to pay off.
Common trap: Students take 15 percent of only the output cost (292) and get about $44. The isodapane measures total transport cost, so include the inputs too.
2. Which statement describes a strength of Rostow's stages of economic growth model?
- AIt explains how colonialism shaped the economies of poor countries
- BIt shows how the core profits from its trade with the periphery
- CIt accounts for every country's unique culture and history
- DIt gives a clear sequence for comparing economic change
- EIt proves that all countries will reach high mass consumption
Answer: D. Rostow's model is simple and describes the path taken by early industrializers such as Britain and the United States. It gives geographers a shared set of stages for comparing countries. Explaining colonialism and core profits are strengths of dependency and world-systems theory instead.
Common trap: Students pick 'proves all countries will reach mass consumption.' A model cannot prove the future, and that assumption is a common criticism, not a strength.
3. In Pittsburgh, once a steel capital, a hospital system and universities are now among the largest employers, and most of the region's big steel mills have closed. Which change in the economic landscape does this show?
- AService and knowledge sectors grew as heavy industry declined
- BThe primary sector grew as the former mill sites became farmland
- CManufacturing grew as hospitals began to produce steel
- DFordist mass production returned to the city's mills
- EAgglomeration ended as firms spread evenly across the region
Answer: A. As steel jobs disappeared, Pittsburgh's economy shifted toward health care, education, and research. These tertiary and quaternary jobs now anchor the region. The CED names the emergence of service sectors as one of the changes transforming the economic landscape.
Common trap: Students pick the Fordist option. Most mills closed rather than reviving. The growth came in services, not in factory production.